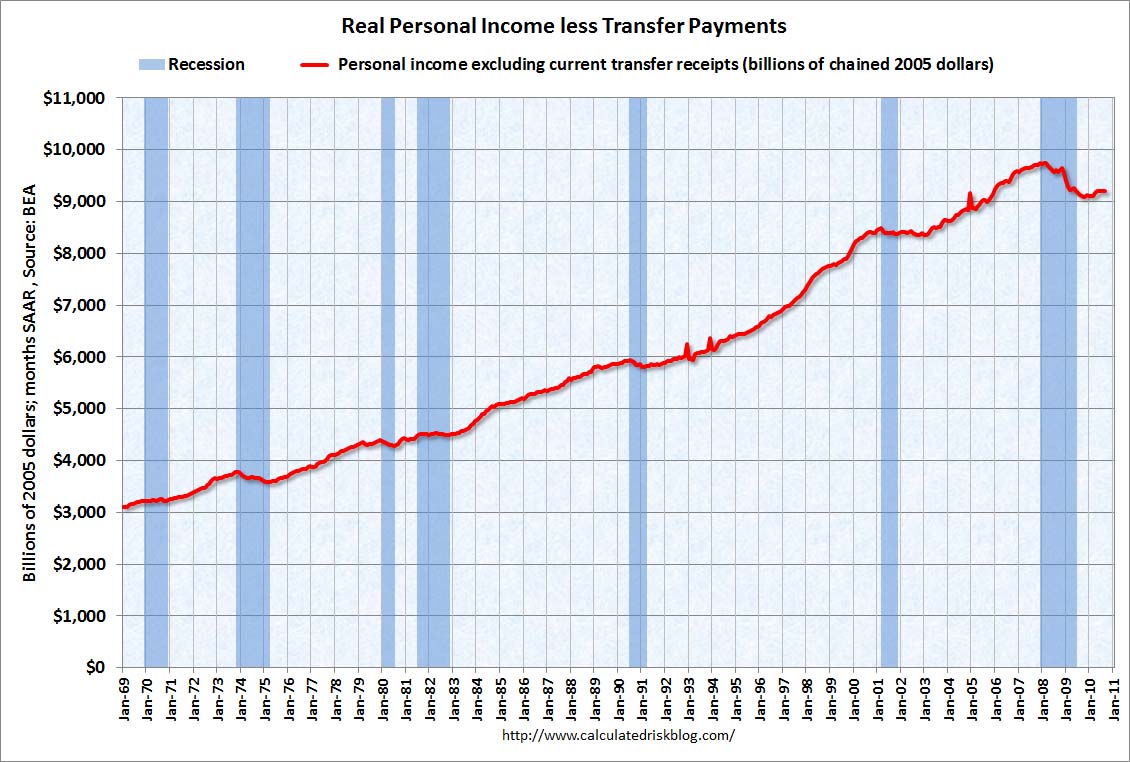
Bill McBride, perhaps the best maker of graphs on the net, has some good ones today that illustrate our economic condition, that goes along with the earlier posted news item on lowered income:
Looking at the past 50 years, the recent recession and aftermath have had a dramatic effect on income, compared to earlier recessions.
And:
Components of Residential Investment as percentage of GDP
We’ve put so many of our eggs into the housing bubble that its demise has created the steep decline in GDP.
