A Rational Approach to the Vaccine Question and Holiday Gatherings

How do we apply good solid statistical math to a subjective problem? The chart above gets a lot more important than we might think.
At some early point, there was a single case of COVID out of a million people globally. That would be about eight thousand cases in the whole world. Unless this is densely clustered in your immediate area, (Hello Wuhan) No reason yet to worry much, put on a mask, or social distance. Shop local, eat out, throw a party. Low risk.
The important number in this pandemic is not the fatality %. Nor is it how many have recovered. Not the odds if you are young vs old. Prevalence is the thing to watch. Prevalence will be an unfamiliar measure to some so let me describe it simply.
A low prevalence means low risk, a high prevalence means a proportionally higher risk of being infected. What is “prevalence? Prevalence is how many have it right now, divided by the population. How many people have it can be calculated by the daily new case count multiplied by how many days you are contagious.
The premise here is that the prevalence in your area is the primary driver of your risks, all other things being equal. This number is what you want in mind when you choose whether to do any of those things that need to happen outside your home. Or inside if you are considering having visitors.
How many of the people near you have it? This is also the risk factor to consider when you decide if you want to be vaccinated against COVID. The vaccine may bring side effect risks worthy of real concern. Those numbers are coming out as the emergency approvals roll out. As a starting point we should use the study data as published and await contrary data rather than just being skeptical of the source(s). So far deaths are zero. Fevers, chills, soreness are quite common in the first day or two.
A safe and effective vaccine certainly brings a dramatic reduction in the risk of you becoming ill. In the instances at hand, Pfizer and Moderna mRNA the result is 85% if you are elderly, 90% or 95% if you are younger and otherwise healthy. If we were still at one in a million, why bother? Easy call to decline because the risk of a side effect might be higher than one in a million. But look at where we are now as compared to a moderate outbreak in Wuhan China.
Prevalence as estimated by my own spreadsheet using numbers as linked.
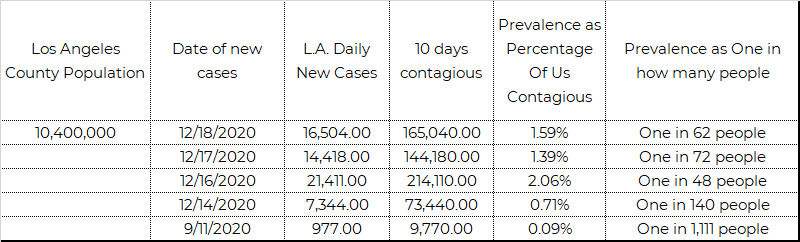
Please observe the difference from the September lull in new cases to the (so far) record high of December 16. One in 50 vs one in 1100. That is staggering and why this is the key number for decision making. Again, it’s disingenuous to just say “it’s 99.5% survivable”. A half percent of the Los Angeles population would be 520,000 if it ran the whole population. In the US that would be 7,500,000.00. Of course some of us would never get infected. Do you want to bet your life would not be one of those? Your loved ones? What of our employers and the economy in that scenario? Total devastation.
For those that want a deeper dive you can get into “Attack rates.”
I found a handy tool, the COVID prevalence calculator. It is more about the attack rate, but that is also very illustrative of the point here. My area is in Los Angeles. I will supply a link so you can run the numbers for yourself and get as far into the details of the tool as you wish. It has the benefit of more statistical sophistication than I could manage on my own. And of course a link to the Los Angeles data source.
preventepidemics.org
publichealth.lacounty.gov
Here we see the results I get from Los Angeles in that tool.


Attack rate/ratio: Refers to the (number of new cases of disease)/(population at risk) during a specified time interval. Generally, the time interval here is defined as “the duration of the outbreak.” (CDC)