Surveying the ‘House Effects’ in Polling
I have always found the science of polling to be fascinating, even if I don’t always understand the concepts or the jargon. @pollster">This article from Pollster is very wonky, but it shows that a majority of the pollsters surveying the 2012 presidential election have some sort of Republican lean, or “house effect.” Not surprisingly, Rasmussen Reports is near the top, but Gallup - which still shows Romney over 50% while the other pollsters, including Rasmussen, do not.
Here is the chart in the article:
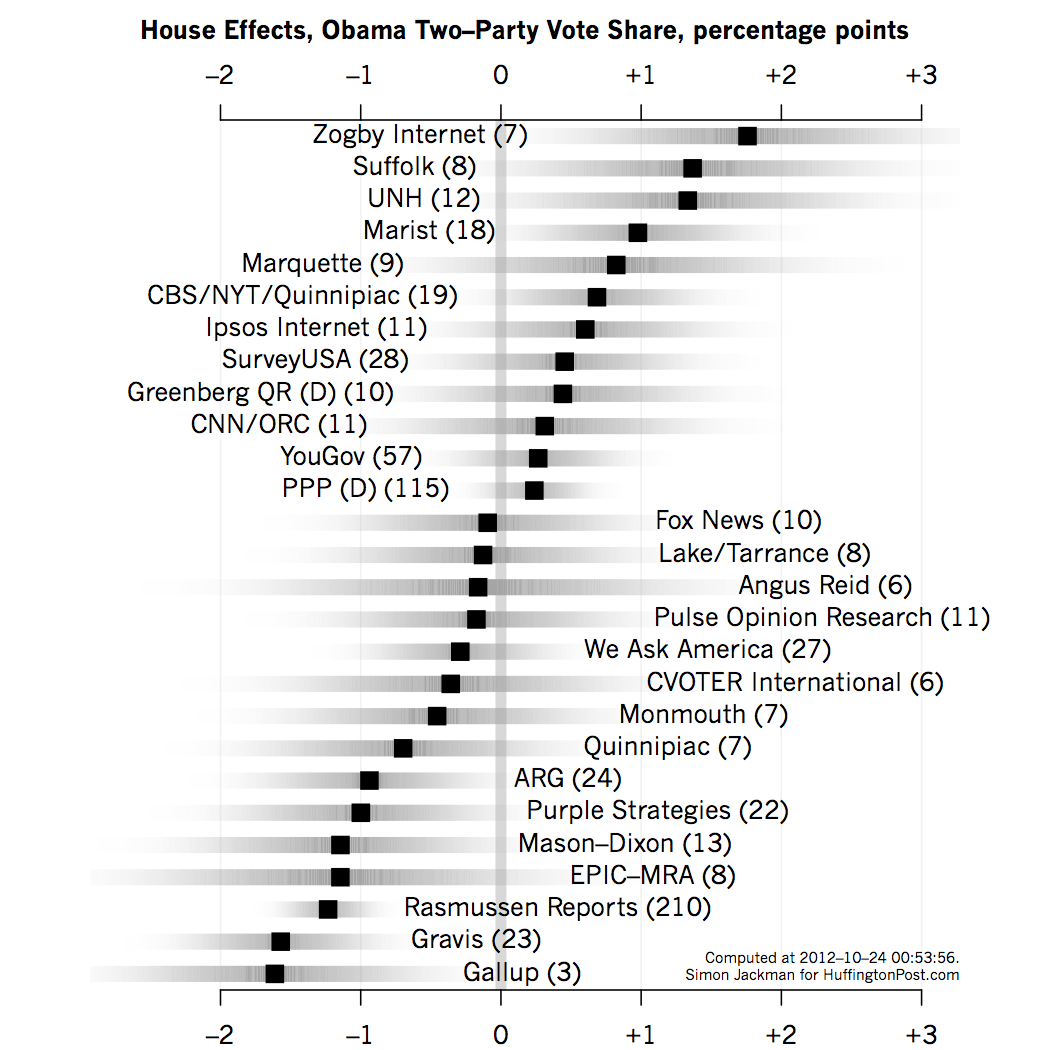
Each row of the graph shows an estimated house effect (solid square) in two-party terms; i.e., the Obama/(Obama + Romney) percentage, not the “raw” Obama percentage reported by any particular poll. The shaded bars convey a sense of the uncertainty around each estimated house effect, roughly extending out to cover a MOE (actually, a 95 percent credible interval). The number in parentheses after each pollster’s name is the number of polls we have for each pollster in the HuffPost/Pollster database as of the time of writing.
Regular poll watchers will not be surprised by the findings here. The most prolific pollster in the Pollster data base — Rasmussen — tends to produce estimates that lean in a Republican direction. The model-based estimate of this bias about 1.2 points in two-party terms. Because Rasmussen polls so much, we learn about their house effect: a 95 percent credible interval (or MOE) around the estimated 1.2 point bias ranges from -1.6 to -0.9, well away from zero.
We have just a handful of Gallup LV polls; Gallup is reporting a week’s worth of polling each day, and the HuffPost database only outputs the most recent series of non-overlapping polls for each run of the model. Thus, as of the time of writing, just 3 Gallup LV polls were available for analysis. Gallup has been producing estimate of the vote share starkly at odds with the rest of the industry, which manifests in an estimated house effect of -1.6 percentage points (in two-party terms) and with a large 95 percent credible interval ranging from -2.7 to -0.5. That is, if the industry consensus was 50-50 (Obama-Romney), we could expect Gallup to produce 48.4-51.6 results.
This is the largest house effect of any major pollster in the data base, 25 percent larger than the Rasmussen house effect. Mason-Dixon also appears to generate a sizeable pro-Romney house effect, as does Purple Strategies and ARG, around about a point of two-party vote share.
Like I said, a lot of this goes over my head, so I wouldn’t be surprised to learn that I’m way off, but perhaps this suggests that Romney’s surge after the first debate, while still real, may have been overstated.